3Dai™: Image Analysis for 3D Tissue Data
3Dai™ uses Artificial Intelligence and Machine Learning to analyze whole tissue datasets.
What 3Dai™ Does
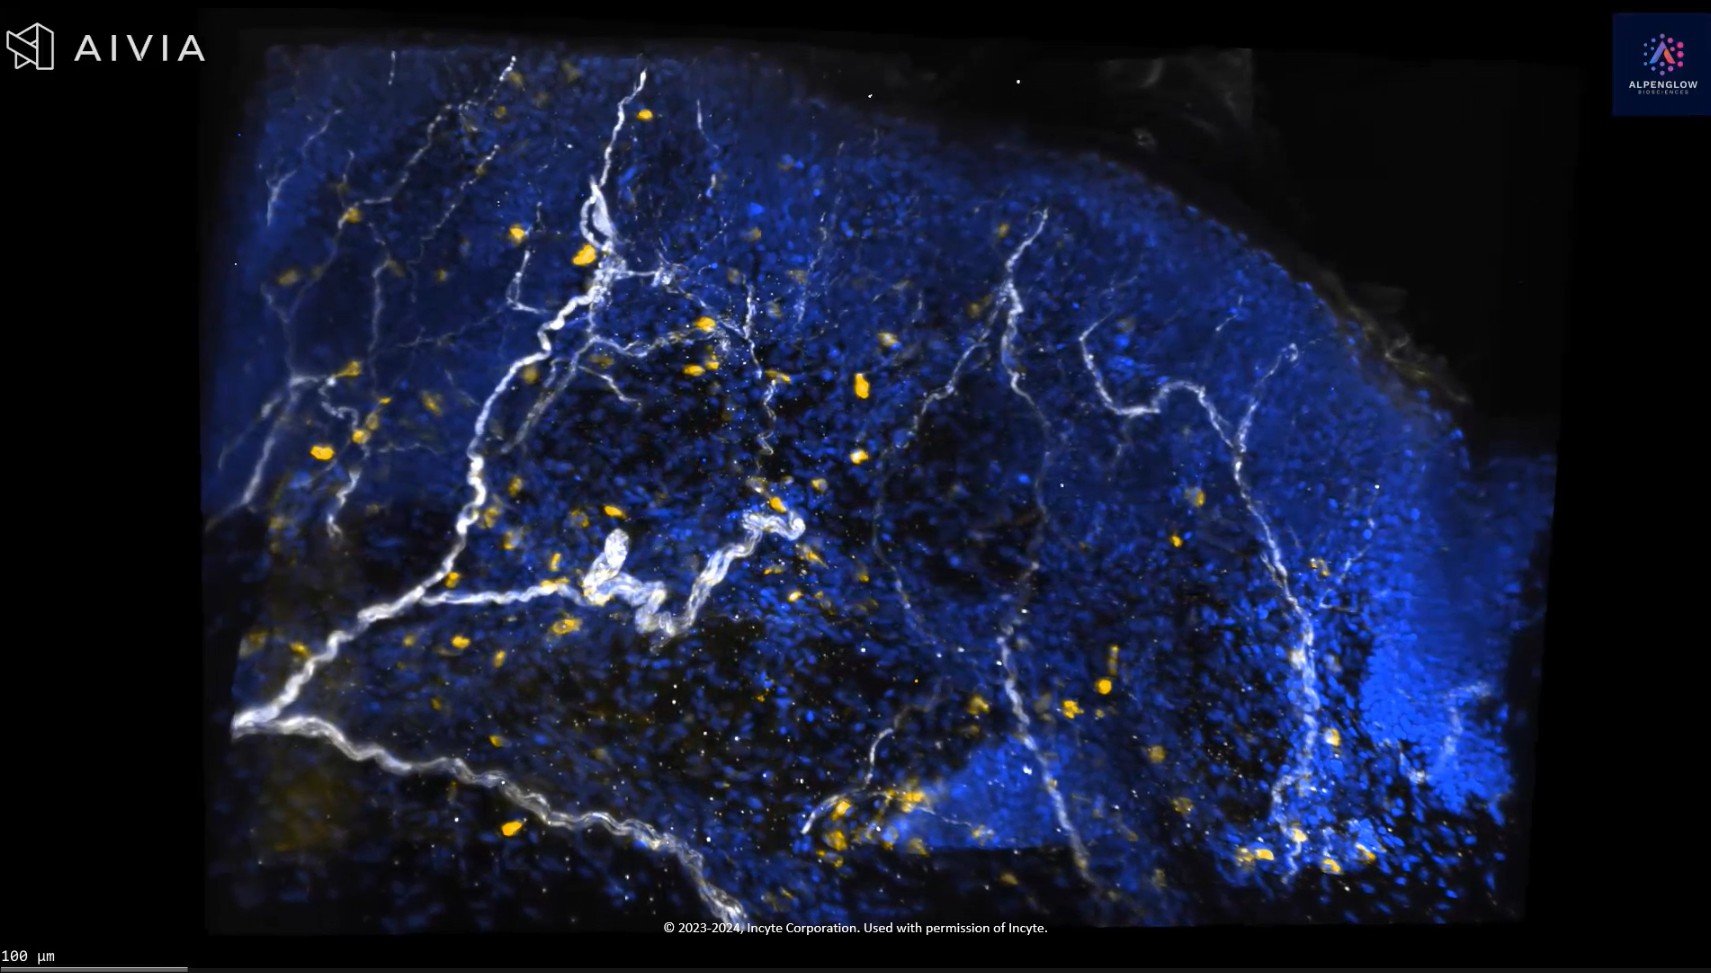
3Dai™ analyzes full tissue volumes using AI-based models that identify patterns, measure spatial features, and quantify interactions across large datasets.
It supports datasets that range from gigabytes to hundreds of terabytes and uses automated pipelines to deliver quantitative outputs that support research, discovery, and interpretation.
The Role of AI & Machine Learning in Our Process
Custom Model Development
Create AI models for specific research needs, ensuring accuracy and reliability
Model Training & Validation
Generate insights into spatial organization and trends in your data
Performance Optimization
Fine-tune models for efficiency to run on 10 – 100s of TB-sized image datasets.
What is Spatial Statistics in 3D Tissue?
3Dai™ applies spatial statistics to examine how cells and structures relate to each other in three dimensional tissue volumes.
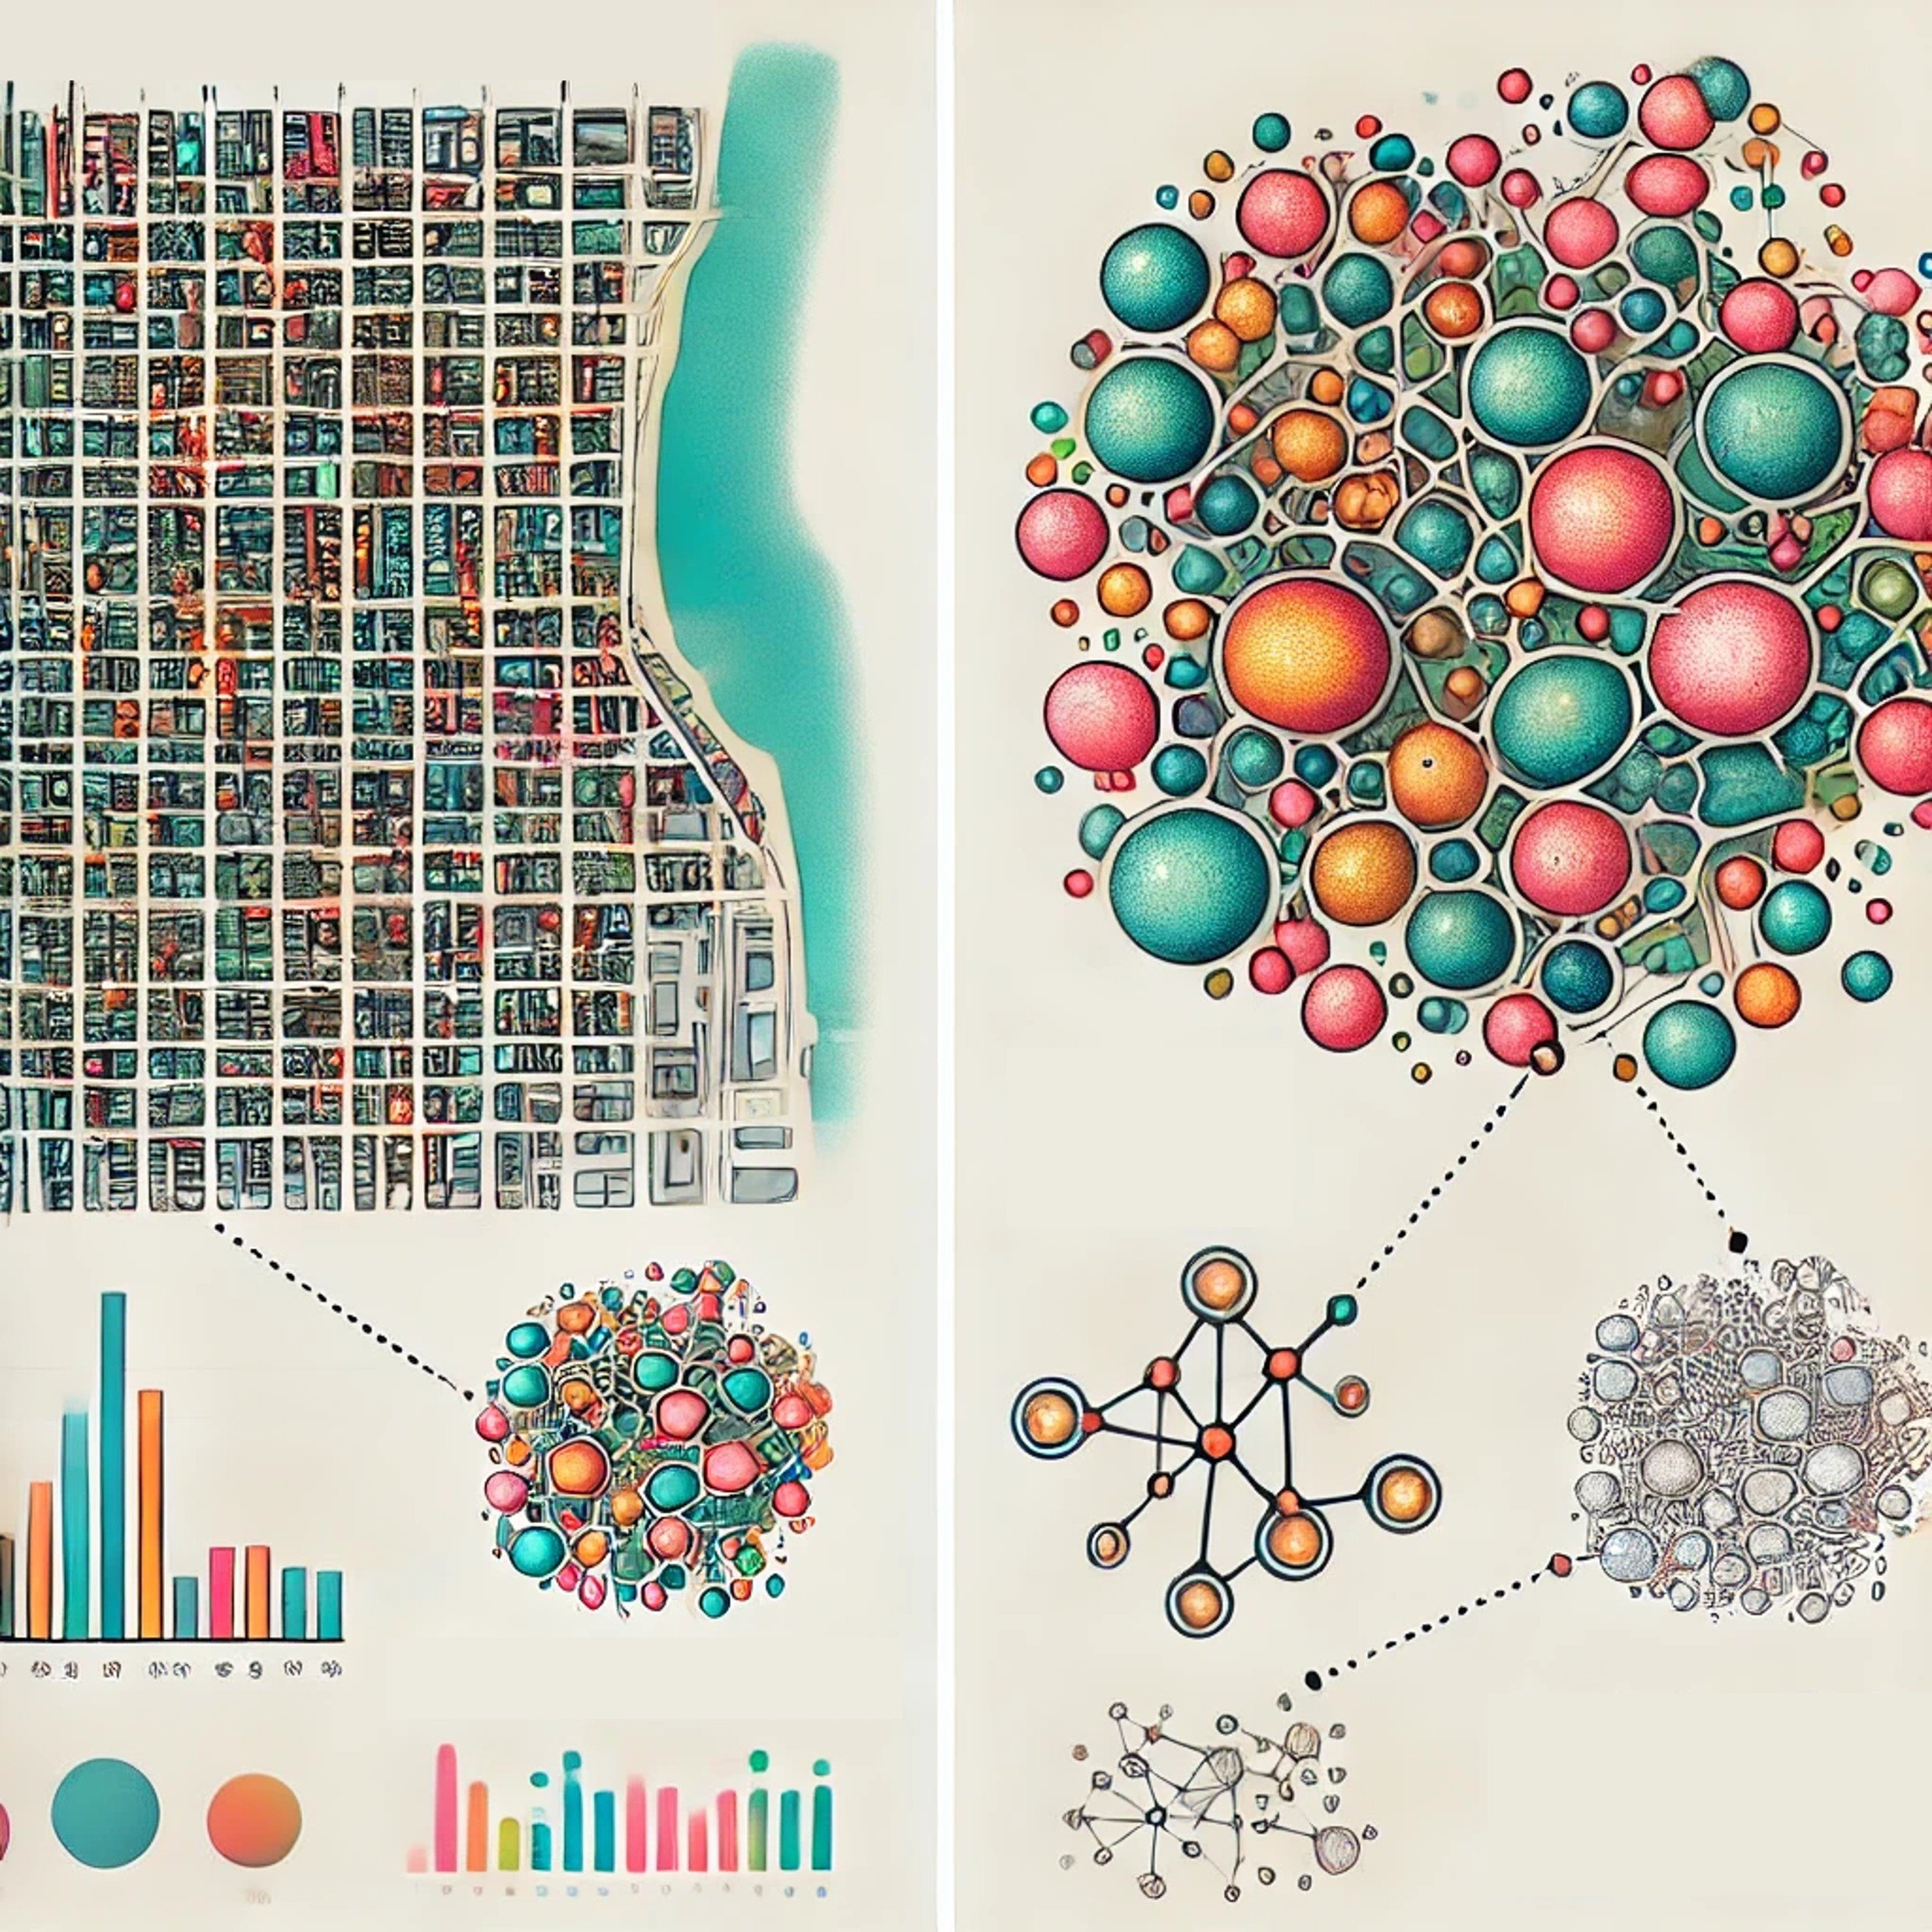
The city metaphor describes this intuitively.
Spatial Relationships
Like interactions between city districts, spatial relationships reveal how cell populations relate to one another across the tissue.
Distance Metrics
Distances between cells are measured like distances between landmarks in a city. These metrics help identify cellular interactions and proximity-based patterns.
Density Analysis
Density measurements reveal how cells or features concentrate in specific regions.
High-density zones can represent biologically active areas.
Clustering Patterns
Like neighborhoods in a city, cells often form distinct clusters. Spatial clustering identifies whether groupings are random or associated with a biological function.
Spatial Analysis Capabilities
Custom Spatial Statistics
Develop tailored analytical methods for unique spatial datasets.
Create quantitative measurements that reflect the specific biology in your samples.
Feature Interaction
Identify relationships between different spatial elements in your tissue.
Analyze how features influence each other within the 3D environment.
Multi-Dimensional Analysis
Explore complex spatial relationships across multiple dimensions.
Combine structural, molecular, and positional information to reveal deeper patterns.
Pattern Detection
Reveal hidden spatial trends and regularities in your data.
Detect recurring structures and interpret underlying biological rules.
Spatial Clustering
Identify groups and patterns within spatial datasets.
Differentiate random variation from meaningful biological organization.
Data Visualization and Outputs
Available 3Dai™ Outputs
3D visualization videos
interactive data viewers
statistical graphs
custom spatial statistics
pattern detection
multidimensional analysis
publication support
3Dai™ converts complex 3D biological data into interpretable visual outputs.
Visualization tools help researchers explore whole tissues, identify key findings and generate publication ready material.


